Snapshot
The most recent central bank meetings were keenly anticipated by investors. Market pricing had been indicating a rising risk of inflation, perhaps stickier and longer lasting than transitory, pricing earlier rate hikes than previous central bank guidance suggested. The sharp flattening of global yield curves also seemed to imply a potential “policy mistake” as short-end rate rises were paired with stable or declining long-end rates in recent weeks. Much of this seemed at odds with central bank messaging that hadn’t really changed in advance of this dynamic taking hold. Had the economic data really changed so much as to suggest an inflection point on inflation and the growth outlook was near? To some degree perhaps, at least in the eyes of the market, but not enough in the end for central banks to meaningfully change their guidance.
The US Federal Reserve (Fed) has long held that elevated inflationary pressures of late are largely the result of the pandemic and will prove to be “transitory”. While this is a convenient view for the Fed to hold in pursuit of maintaining easy monetary policy for longer, it may also prove to have been wishful thinking that inflationary pressures would abate any time soon. Most of the pressures are on the supply side: between supply chain disruptions and the inadequate supply of qualified labour, input prices are going up, which is now exacerbated by an energy price crunch. While supply side pressures have a way of working through bottlenecks by increasing investment and retraining labour, it takes time for pressures to ease.
While demand remains resilient, it is far from excessive. Central banks could certainly tighten policy sooner to reduce demand with the aim of easing price pressures, but it would also end the recovery that policymakers have worked so hard to maintain throughout the pandemic. The Fed has indicated a willingness to look through current supply side dislocations in the hope they will essentially self-correct, so the question becomes whether it will remain patient in the face of strong inflation outcomes in coming months. We believe it will stay the course—at least for now—which means markets have overestimated a hawkish pivot. While inflation pressures are real and uncomfortably high, it has yet to seriously dent demand or squeeze profit margins, so we remain constructive on the US growth outlook.
Cross-asset1
We upgraded our view on growth assets on the premise that global demand remains robust and growth in corporate revenue and earnings are still healthy, while markets are positioned more conservatively due to expectations of less rosy outcomes. We also maintain our negative view on defensive assets for the upside pressure on yields as central bankers determine the path for reducing accommodation and eventually lifting rates.
Within growth assets, we increased our positive view on both developed and emerging markets equities as the main beneficiaries of a still-healthy demand cycle. At the same time, we turned more cautious on our more defensive growth exposures in both REITs and listed infrastructure. We had been favouring REITs for their exposure to the re-opening theme but believe this has generally run its course with less upside ahead.
Within defensive assets, we downgraded our view on investment grade credit and developed market sovereign bonds on our belief that upward pressures on long-term rates will continue, despite the recent pullback. In contrast, we turned more positive on emerging market local currency bonds and gold. The former offers a decent yield buffer to rising developed market yields and should benefit from currency support while the latter is finding support from rising inflation expectations, keeping real yields in check.
1The Multi Asset team’s cross-asset views are expressed at three different levels: (1) growth versus defensive, (2) cross asset within growth and defensive assets, and (3) relative asset views within each asset class. These levels describe our research and intuition that asset classes behave similarly or disparately in predictable ways, such that cross-asset scoring makes sense and ultimately leads to more deliberate and robust portfolio construction.
Asset Class Hierarchy (Team View1)
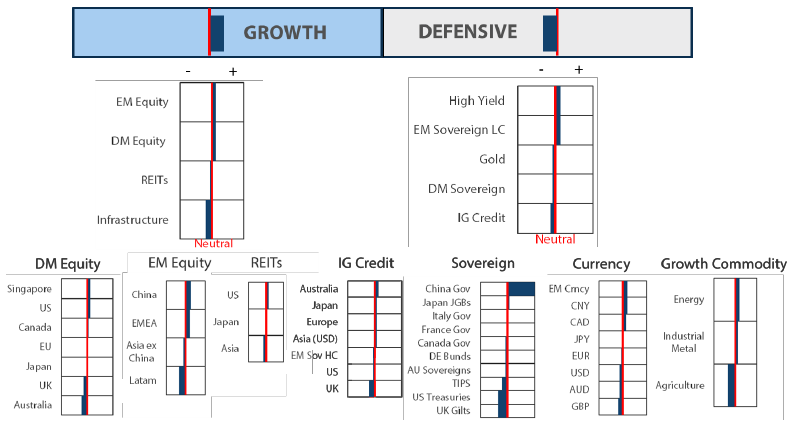
1The asset classes or sectors mentioned herein are a reflection of the portfolio manager’s current view of the investment strategies taken on behalf of the portfolio managed. The research framework is divided into 3 levels of analysis. The scores presented reflect the team’s view of each asset relative to others in its asset class. Scores within each asset class will average to neutral, with the exception of Commodity. These comments should not be constituted as an investment research or recommendation advice. Any prediction, projection or forecast on sectors, the economy and/or the market trends is not necessarily indicative of their future state or likely performances.
Research views
Growth assets
The growth outlook is still improving on the back of spreading demand, a dissipating COVID-19 impact and still-easy policy where central bankers (at least in the developed world) have reminded markets that they are willing to stay patient and look through current inflationary pressures. This makes sense because current inflation is mainly driven being driven by supply disruptions, and such disruptions tend to work themselves out over time.
However, as current US inflation hits levels not seen in 30 years while the drivers are spreading beyond COVID-19-stricken sectors, the markets will probably continue to test the Fed’s resolve in committing to such patience. Demand is strong in the US—thanks to generous stimulus, still-high levels of excess saving and decent wage growth.
While inflation will undoubtedly decline from current levels, it is also likely to settle at a level above 2.5%, which is the level markets have assumed the Fed would be comfortable with toward achieving its symmetric inflation targeting mandate. While the Fed’s reaction function may still be unclear, it is clear that policy will remain easy for some time as demand continues to recover, which is supportive of growth assets. Inflation is not yet destructive for demand or margins, so we remain constructive—call it the “inflation boom” part of the cycle.
Taking stock as the COVID-19 dust settles
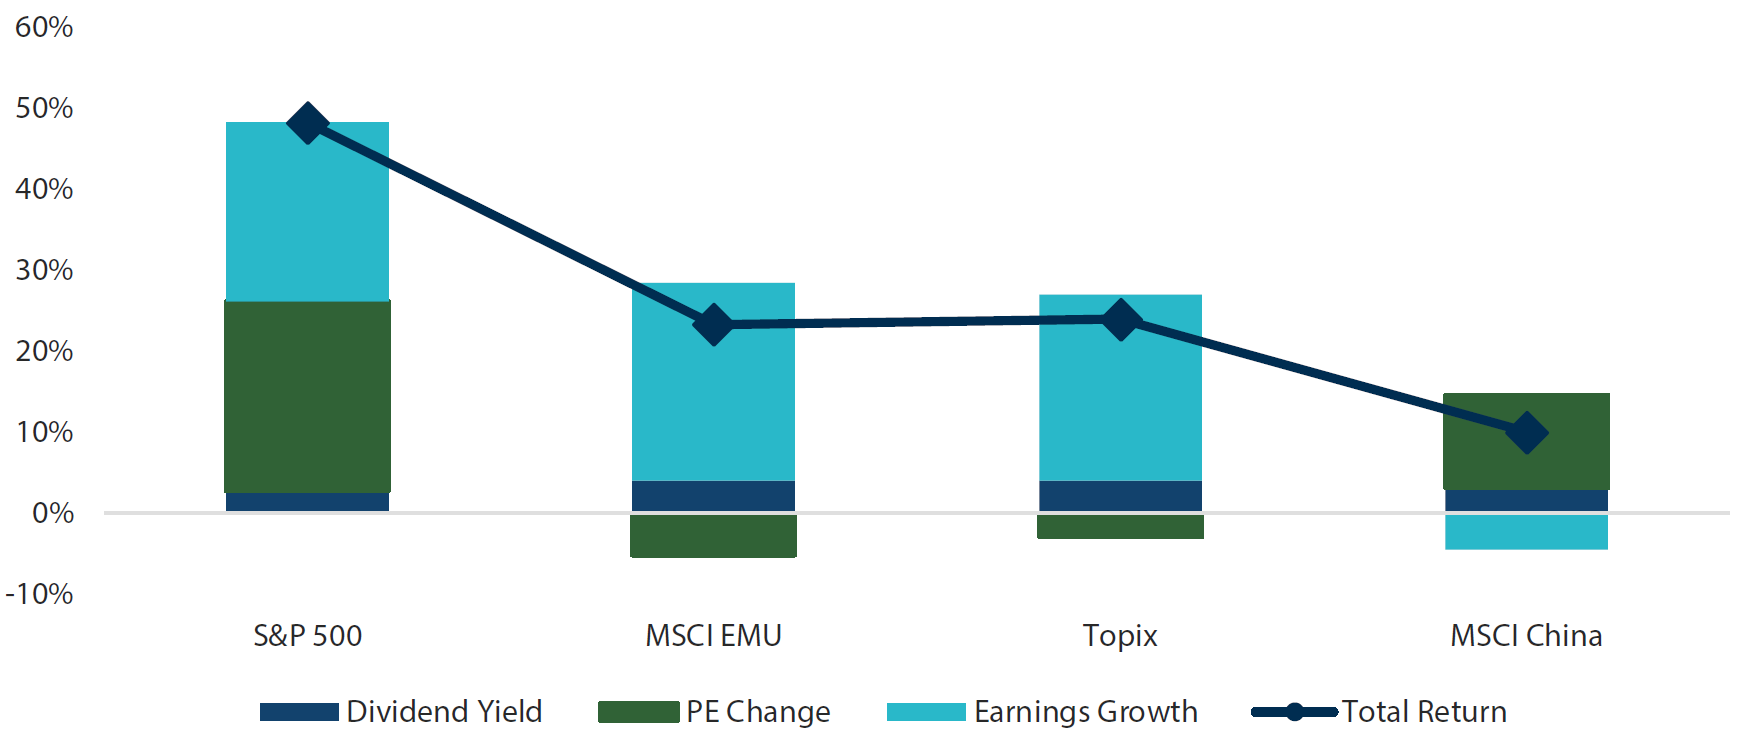
When COVID-19 struck, never had equity markets collapsed to such a degree in such a short period of time, while the recovery—particularly in the US—also set records in clawing back losses in a very short period on the back of massive monetary and fiscal stimulus. But not only were losses clawed back, the rally continued. Ultimately, the massive stimulus translated into massive earnings gains outside of China, which had a different agenda. Once again, US equities trounced the rest of the world in overall performance for its massive re-rating—a rising price-earnings ratio meant that valuations were getting more expensive.
Chart 1: Contributions to total return (Jan 1, 2020 – Nov 10, 2021)
 Source: Bloomberg, Nikko Asset Management Asia, November 2021
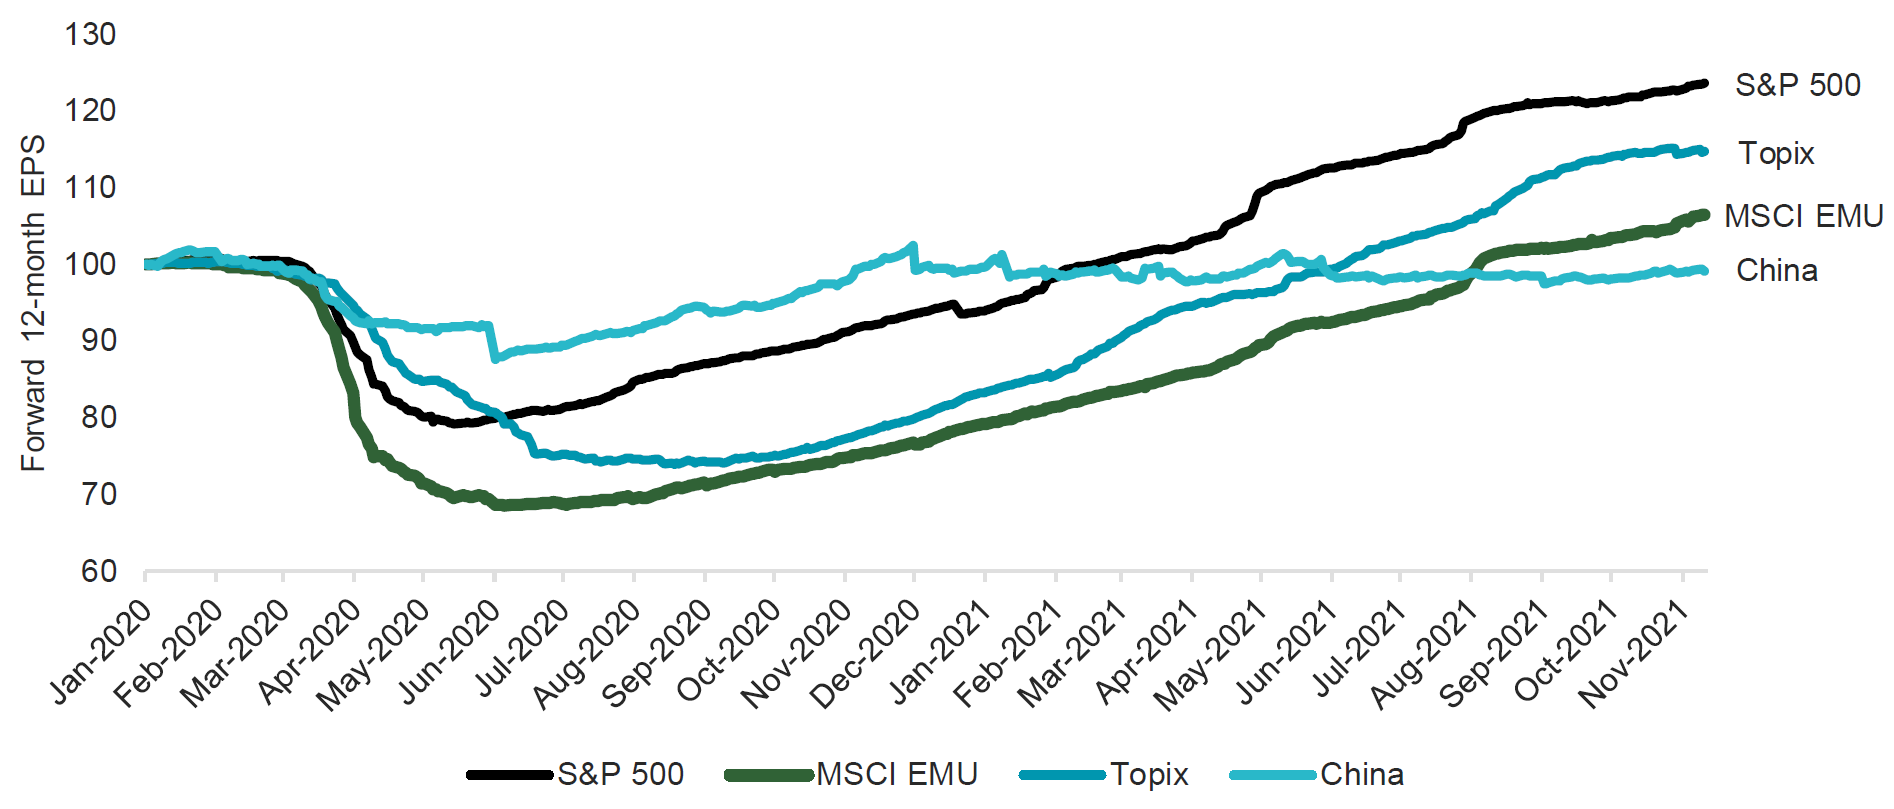
Massive re-/de-ratings can be partially understood through witnessing the journey of expected 12-month earnings. While the US, Europe and Japan all realised about 22-24% earnings growth over the same period, earnings growth expectations are highest in the US, followed by Japan and Europe with China at the bottom of the heap—staying basically flat since late 2020.
Chart 2: Forward 12-month earnings
 Source: Bloomberg, Nikko Asset Management Asia, November 2021
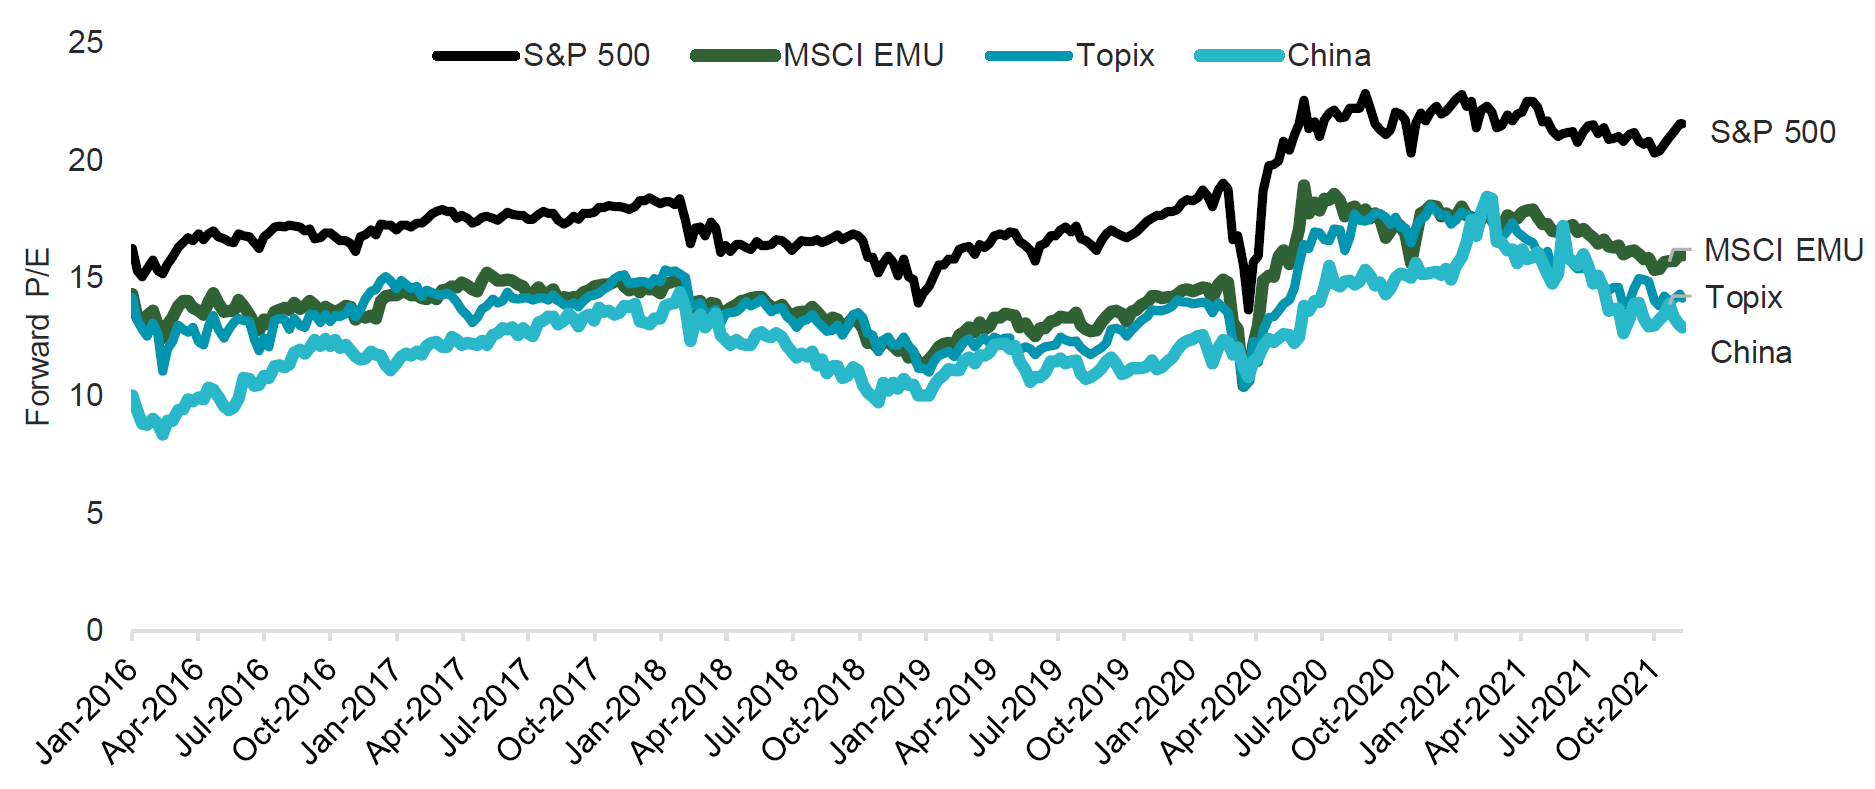
Not surprisingly, analysts are quite depressed on China’s growth prospects owing to its tight policies, and almost giddy on the US as easy policy just keeps on coming. We know that at least part of these forecasts is backward-looking because analysts cannot help but extrapolate past experience into the future. But market multiples (price-to-earnings) on these forward estimates tell us that markets are even more bullish than analysts on the US versus the rest of the world.
Chart 3: Price / Forward 12-month earnings
 Source: Bloomberg, Nikko Asset Management Asia, November 2021
Many investors have been burned pulling out of US equities over the last decade on the premise that the market is “too expensive”. Yes, it seems too expensive, particularly when compared to the rest of the world, but over the last decade, no market has delivered earnings quite like the US. Yes, these companies are at the forefront of innovation and disruption, but policymakers also have the equity market’s back, including the long-standing Fed put and now ample fiscal stimulus.
While it may not have paid off to be a contrarian against US equities, and it still may not be for some time, it still can pay to be a contrarian against an overly depressed market. China equities are not dirt cheap, but analysts and market participants may still have grown too gloomy, missing the potential for better earnings prospects ahead.
Conviction views on growth assets
- Favour China: Policymakers have signalled that the worst of the regulatory crackdown may be over, for now. “Common prosperity” is so far reflected more as leveling the playing field rather than simple wealth re-distribution. Easing will likely arrive before the end of the year and continue into next, and we expect this event to serve as a catalyst to begin an equity market recovery.
- Cautious on Europe: Europe benefited from a reflationary theme based on falling COVID-19 cases, but now cases are back on the rise. Europe may also be the epicentre of the global energy shortage where issues there are more acute. Lastly, European financials benefited from rising rates, which we believe is likely to reverse as central banks stay dovish.
Defensive assets
We maintained our cautious view of defensive assets again this month. Markets have begun to speculate that central banks will need to end quantitative easing (QE) sooner and bring forward the start of the next rate hike cycle. This led to a bearish flattening of yield curves in a direct challenge to the common central bank line that inflation pressures are "transitory". However, in the most recent slate of central bank monetary policy meetings, officials resisted pressure to bring forward tightening cycles. Central banks may have won this round, but inflation pressures have not abated. We expect this tug-of-war between market expectations and forward guidance to continue in coming months.
Within global credit, we downgraded our view on investment grade corporate bonds this month as valuations remain expensive and momentum has now turned negative for the asset class. While credit quality is still strong and improving, our expectations of rising global yields will be an ongoing headwind to corporate bonds. On the other hand, we upgraded our view on high yield credit as it benefits from a strong growth environment and very low default rates as the pandemic recedes. We also upgraded our view on emerging market local currency bonds as a higher yielding buffer to rising rates in developed markets and a beneficiary of a weaker US dollar.
We have improved our view on gold but remain cautious. Gold prices bounced back in October after weakness in the prior month. Inflation pressures continued to build, keeping break-even inflation rates elevated and real yields sharply negative. However, the negative real yields are partially suppressed by the Fed’s QE programme and are increasingly inconsistent with a stronger global growth backdrop.
A recent history of US tightening cycles
The most recent Federal Open Market Committee (FOMC) meeting heralded the long-awaited beginning of a gradual and measured retreat from the extraordinary monetary policy support measures introduced during the pandemic. The first step, a tapering of QE, had been telegraphed for many months and contrary to the “taper tantrum” in 2013, was met with a collective yawn. Nevertheless, the announcement also started an implicit countdown to the start of only the third tightening cycle in the last 20 years.
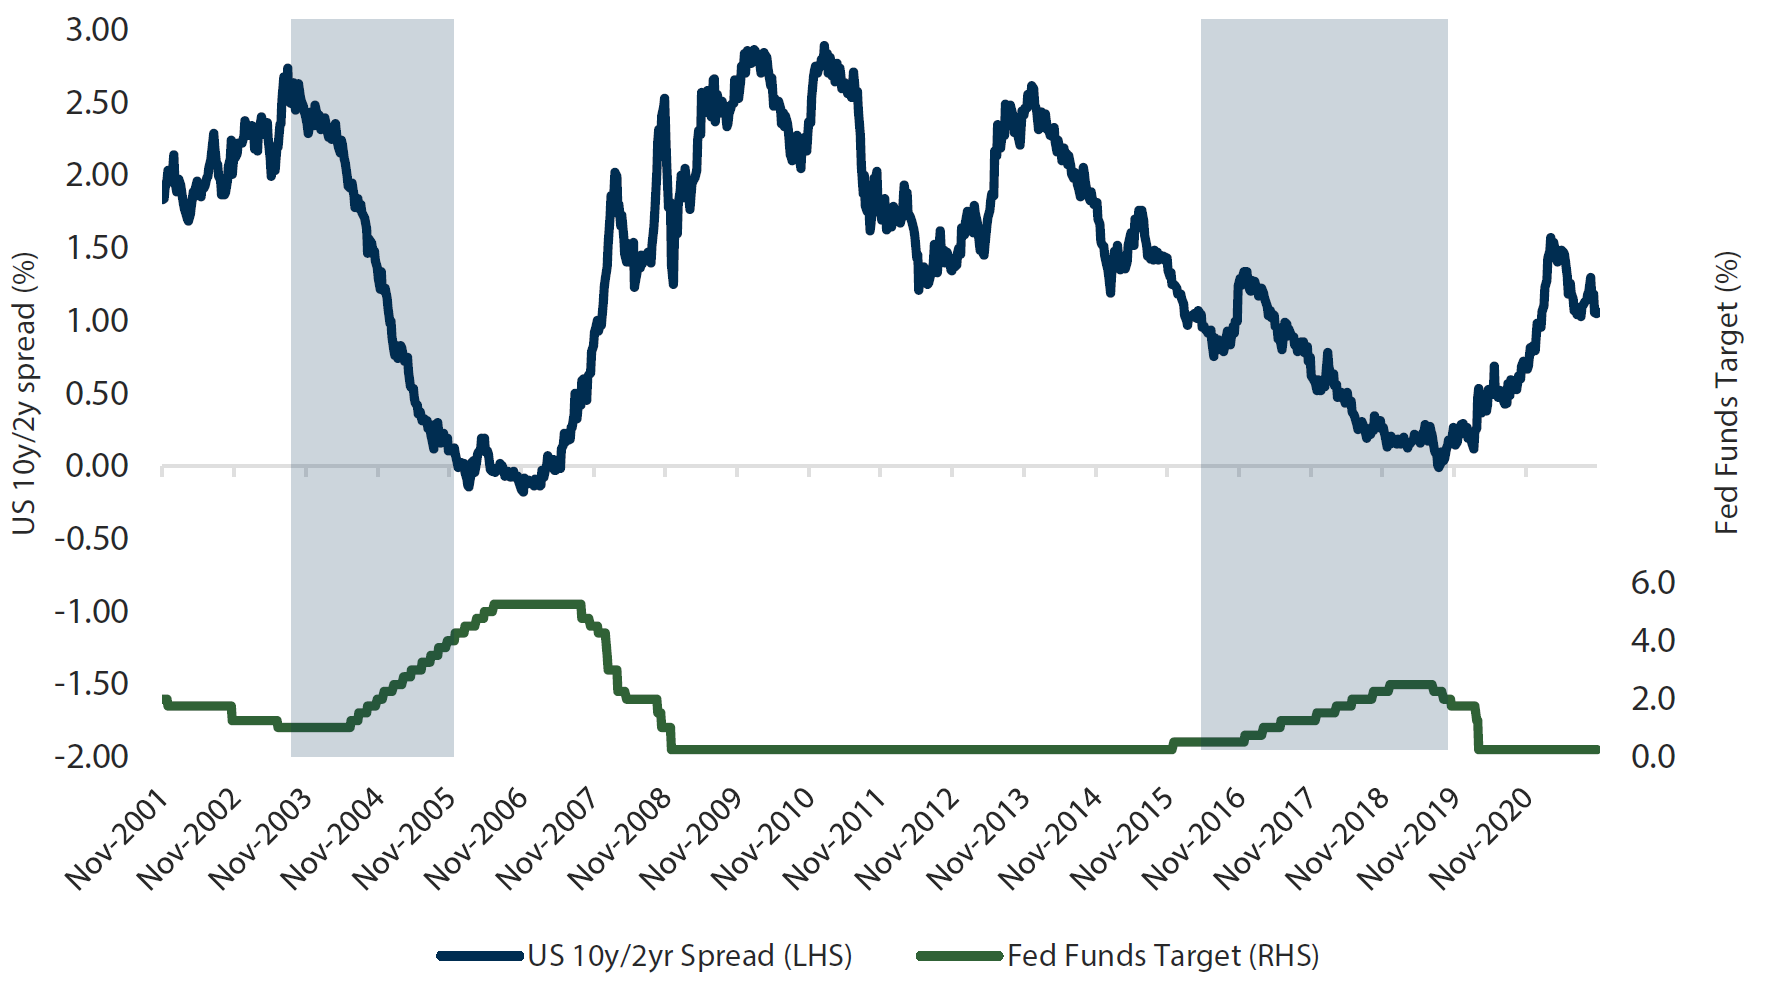
While the first hike in the Fed Funds target range may still be many months away, we find it useful to review the two most recent US tightening cycles in 2004 to 2006 and 2015 to 2018 to provide some context for what may lie ahead for fixed income markets. Chart 4 shows the spread between 10-year and 2-year US Treasury (UST) yields as a proxy for the shape of the yield curve and the Fed Funds rate target covering the period of both tightening cycles (the shaded areas highlight the duration of each cycle). There are two commonalities that mark the behaviour of the yield curve in both cycles. The first behaviour is obvious: the yield curve flattens and does so at a pace that mirrors the pace and duration of the rate hikes. A sharper flattening of the yield curve accompanies the more aggressive tightening in the first cycle and a more gradual flattening shadows the second cycle. The second common feature is that the yield curve flattens steadily until it reaches zero, or even inverts, as the market becomes convinced that the cycle has ended. When we consider the recent beginnings of flattening moves in global yield curves, it is clear this should be largely expected in the context of prior tightening cycles.
Chart 4: UST yield curve and Fed Funds target
 Source: Bloomberg, November 2021
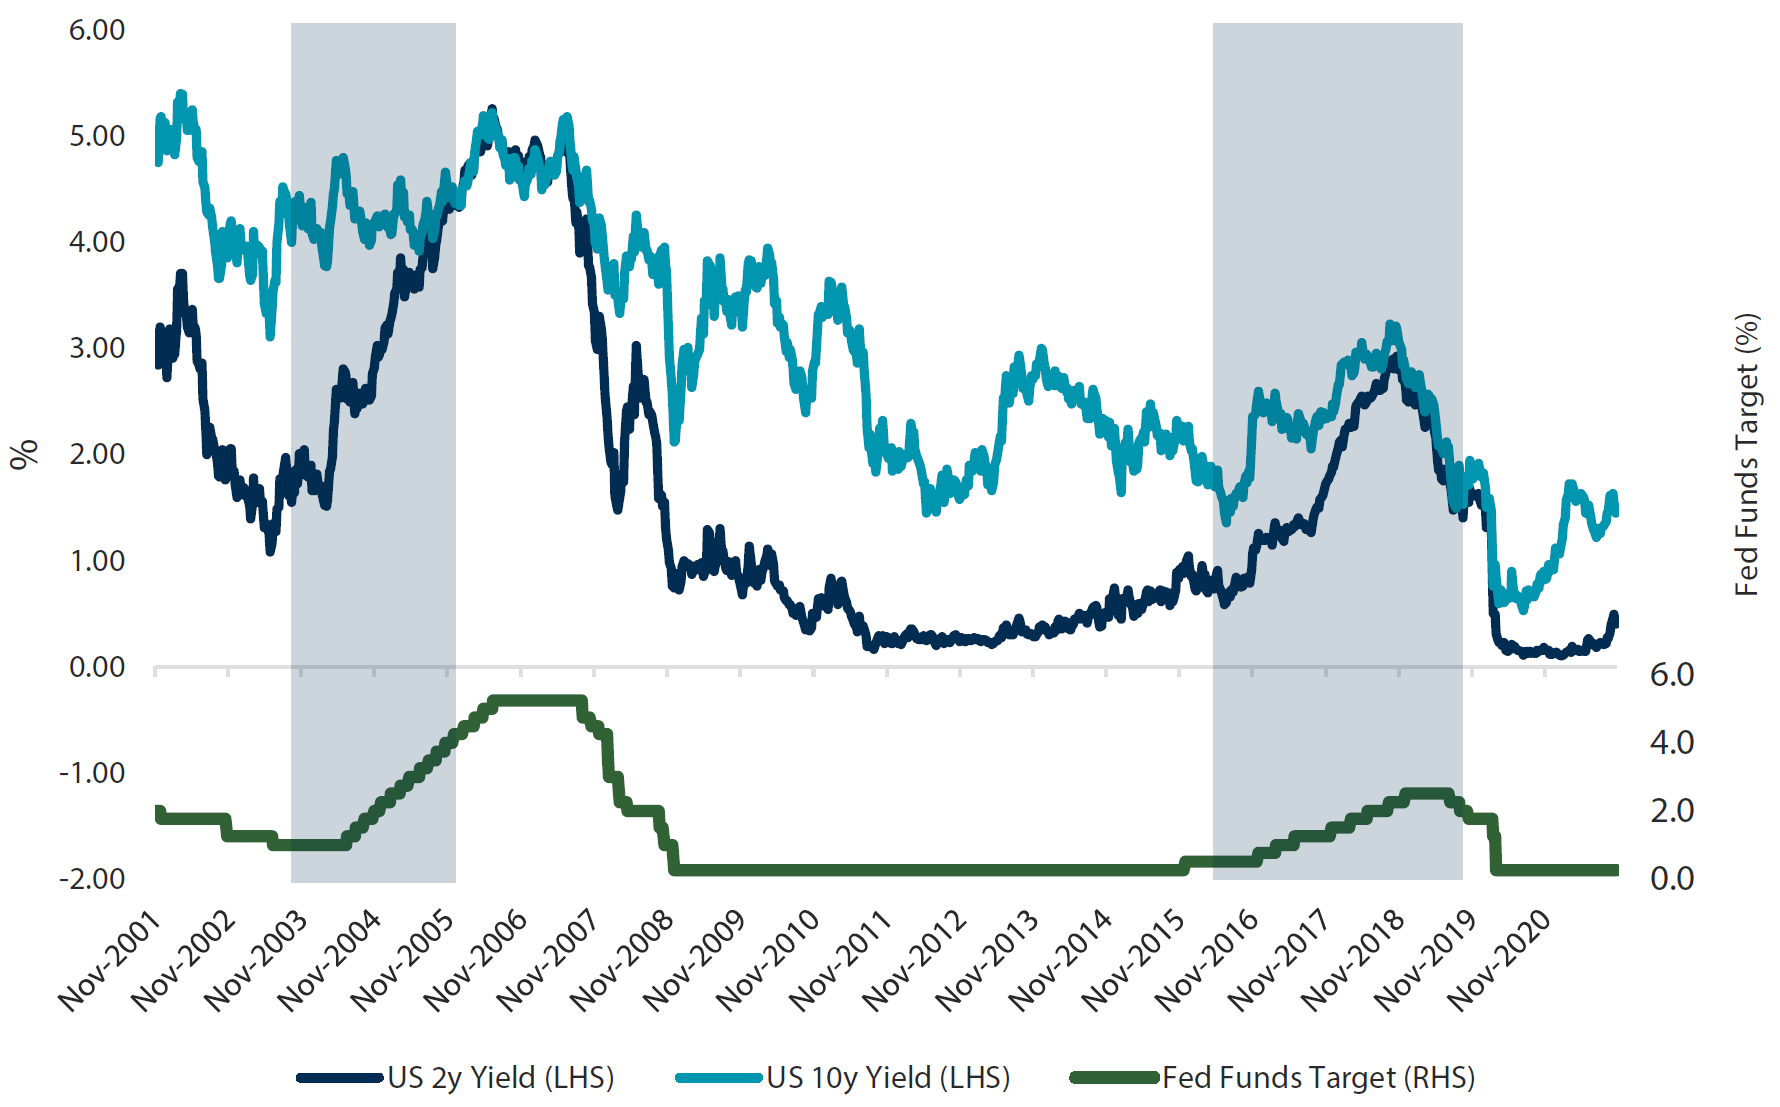
Looking at the movements of each end of the yield curve over the same period in Chart 5 reveals a few other notable features of past tightening cycles. The first one is that the yield curve flattening we just discussed is led by the 2-year yields rising to meet the higher starting point of 10-year yields in both cases. And while today’s UST traders have already started to play the game of “pick the high in 10-year UST yields”, we would note that the eventual high didn’t reveal itself until the end of both prior tightening cycles, not at the beginning. Suffice to say, early entrants in this contest beware.
Chart 5: UST 2-year & 10-year yields and Fed Funds target
 Source: Bloomberg, November 2021
Another feature to highlight relates to the levels of bond yields reached at the conclusion of the tightening cycles relative to the Fed Funds target rate. In the earlier cycle, the target rate reached a maximum of 5% and both 2-year and 10-year yields topped out at around 5.2%, slightly exceeding the terminal Fed Funds rate. The more recent cycle had a terminal rate of 2.5% with 2-year and 10-year yields peaking at about 2.9% and 3.2%, respectively. In both cases, UST yields overshot the terminal cash rates near the end of each cycle. Should these historical precedents hold in the coming few years, thinking about where a future tightening cycle ends up provides a useful indication of what bond yields levels may represent longer term value.
Conviction views on defensive assets
- China bonds still favoured: China’s government bonds offer higher yields and lower volatility and continue to have “safe-haven” appeal within the sovereign bond universe.
- Less duration in dollar-bloc bonds: Central banks have maintained dovish forward guidance in the face of market pressure to bring forward rate hikes. They may have won the first round but with QE tapering underway, the countdown to tightening cycles has begun.
- Australian short end the standout: The Reserve Bank of Australia (RBA)’s recent decision to cut its yield curve control policy adrift sent bond yields sharply higher. The significant yield premium in Australian 3-year bonds now seems at odds with its less threatening inflation profile and the RBA’s base case of no rate hikes until early 2024.
Process
