


Snapshot
The seemingly impossible soft landing on the back of one of the most aggressive monetary tightening cycles in history is looking not just possible, but increasingly probable. US data is coming in stronger (again), supported by decent labour, easier financial conditions and now, an upturn in the global manufacturing cycle. Global demand is generally steady with increasing channels of potential upside.
We have generally favoured secular growth opportunities such as US technology (tech) and equities in Japan for the country’s structural reforms, and we have sought balance in the form of commodity-linked equities that offer both strong cash flow and a natural hedge to stickier inflation. We always look for new cyclical opportunities, but so far, we still like the mix. We do not see rate cuts being as aggressive as the markets expect, but nevertheless the trajectory is positive for growth assets.
As always, risks remain—the Middle East is currently running hot on the geopolitical risk spectrum, US regional banks remain a potential flashpoint of high systemic stress and parts of the real economy are still reeling from the weight of the highest rates seen in decades. We believe our balance of equities combined with yield, moderate duration and gold offer an attractive risk-return profile that collectively will remain durable under a variety of market outcomes, including the aforementioned event risks.
Cross-asset1
We increased our growth asset score to overweight, while maintaining our defensive score at neutral. The markets (once again) got ahead of themselves in pricing rate cuts after central banks’ shift to a more dovish tone over the past two months, despite the consistently strong economic information that is emanating from the US.
The US economy continues to show signs of strength, with the GDP growing 3.1% in 2023. As inflation comes down globally, this sets the scene for a relatively positive backdrop for 2024, as the potential for rate cuts is likely to benefit risk markets. This could see growth assets start 2024 on a strong footing, despite the restrictive interest rate stance. Despite the strong economic data releases, the bond markets remain convinced that easier policy will soon arrive, as the market forecasts the US Federal Reserve (Fed) to cut rates five to six times in 2024. While we agree that interest rates are likely in restrictive territory, we are less convinced that inflation has been quelled and that aggressive easing will be required.
While equities have generally continued to find support—some markets achieving new highs—sentiment is relatively subdued, and this is a generally favourable environment for prices to grind higher. We still favour a combination of secular and some cyclical growth themes, coupled with commodity-linked equities that have support from attractive valuations and strong cash flows while also buffering the portfolio from a “higher for longer” policy profile should inflation prove to slow in its descent.
We left our defensive scores unchanged at neutral, with an overweight bias towards income-generating assets such as investment grade (IG) credit and emerging market (EM) local currency bonds. Since we still believe markets may be pricing rate cuts too aggressively, we remain underweight duration in favour of short-dated credit yield. The combination of decent yields coupled with favourable growth conditions both support a fair return outlook for 2024. Should interest rates move back up, we would view this as a good opportunity to add additional rates to the portfolio, but overall, we want to remain patient given global bond curves are hugely inverted.
Asset Class Hierarchy (Team View2)
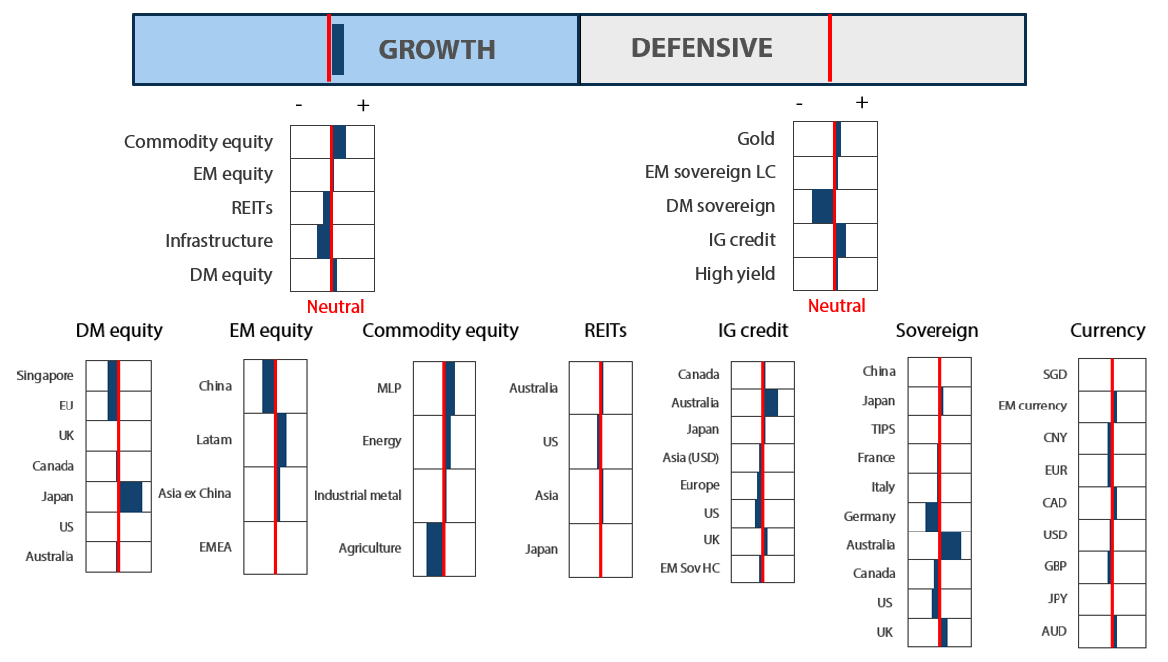
Research views
Growth assets
It has been a strong start to the year for equity markets that we like, including Japan and US tech (Nasdaq), so we have taken the opportunity to rebalance and top up exposures like energy that had drifted lower in weight due to outperformance elsewhere. We remain constructive for the remainder of 2024, happy to get a healthy yield in our credit portion while seeing decent upside potential in our global equity portion.
We often discuss earnings and valuations in this publication, but for this month, we take a deeper dive into cash and cash flow as another important lens to understand the fundamentals of the growth assets that we like. It also pulls a common thread through otherwise different and often unrelated themes. Cash and cash flow are extremely important metrics that help to appreciate the sustainability of growth across all of our themes.
Cash and cash flow
We often discuss earnings and the variety of metrics that influence the trajectory as well as valuations. There are a variety of fundamentals that matter and chief among them are available cash and free cash flow that underpin the strength of a business and its ability to deliver a healthy return on capital in the form of dividends, productive capex for future growth and/or share buybacks.
Japanese equities are amid structural reforms, which includes improving the price to book (PB) where ratios fall well below market norms. The Tokyo Stock Exchange (TSE) is mandating at least a PB ratio of 1 to stay listed, and companies are making gradual progress. On its face, it seems an easy hurdle as a ratio less than 1 implies that investors value the company at something less than the assets on its balance sheet—effectively not ascribing any value to the companies’ ability to generate cash flow.
On the other hand, Japanese companies are generating cash and have accumulated unusually large cash balances as compared to their geographical peers (Chart 1). Considering that Japan has likely exited deflation, interest on cash balances is still negative and inflation continuously erodes buying power, Japanese companies are beginning to put this capital to work, including ramping up share buybacks which is a straightforward way to lift the PB in line with TSE requirements. Our expectation is that reforms will have a significant positive impact on Japanese equities in the months and years ahead, not just out of reforms but for the straightforward necessity to create value that can stay ahead of inflation.
Chart 1: Japan growing cash (% of balance sheet)
Source: Bloomberg, February 2024
While Japanese companies are seeking to put their high levels of cash to work, US tech companies are generating a staggering amount of free cash flow. Looking back five years, there is no question that these companies benefitted from the enormous stimulus injected in the economy following the COVID-19 pandemic. Free cash flow began to dwindle in 2022 as the stimulus wore off. But free cash flow has firmly accelerated from mid-2023—up almost 20% from the early 2022 peak (Chart 2).
As we have long mentioned, the investment in tech and artificial intelligence (AI) is exceptionally high as the largest tech companies are effectively in an arms race to reap the new opportunity’s maximum return potential. Strong cash flow coupled with large investment effectively trickles down to benefit the entire sector and ecosystem. Valuations look expensive compared to history; however, accelerating free cash flow, the extent of investment and earnings growth have rarely been seen at any time in history. We still like this strong secular growth theme.
Chart 2: NASDAQ 100: price versus projected 12-month free cash flow
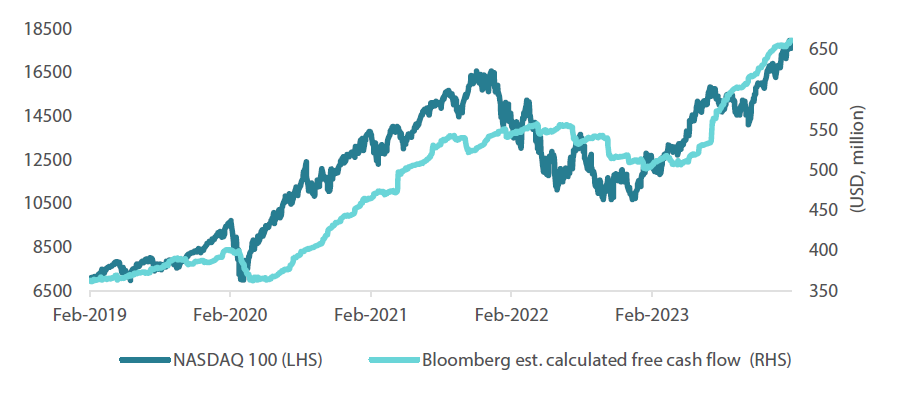
Source: Bloomberg, February 2024
Energy is a very different sector than tech, but is also seeing outsized free cash flow, partly due to less investments in new production capacity. Energy has been a relatively unloved sector of late, but the underlying equities are very cheap, while buybacks are high and energy prices are stable. In fact, we see scope for energy prices to rise as the economy looks to be picking up pace through recent data and evidence of an upturn in the manufacturing cycle, which generally benefits demand for energy and other commodities .
Chart 3: Oil majors’ free cash flow (millions USD)
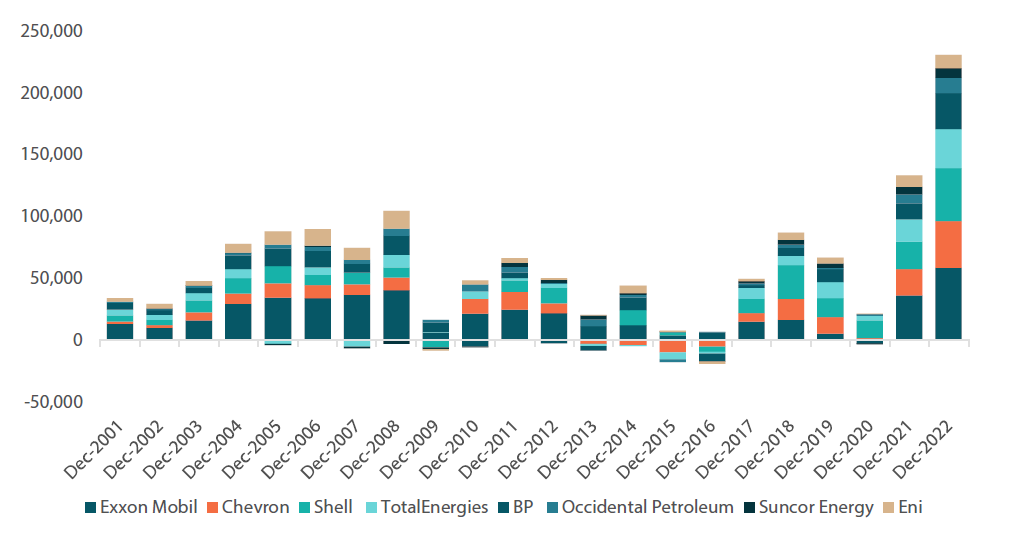
Source: Bloomberg, February 2024
In today’s environment, finding sustainable diversification is still tricky. The correlation between bonds and equities looks to be turning less positive, but we find that through combining distinct equity investment strategies underpinned by strong independent fundamentals, we can still incorporate a healthy degree of diversification. If anything, energy could serve as the biggest diversifier against inflation and rising rates should such conditions reappear.
Conviction views on growth assets
- Japanese equities are a top pick : Reforms are starting to have an impact though these are early days. We expect to see a firmer impact on profitability and earnings later in 2024. Japan is attracting foreign direct investments away from China, and collectively, we expect new investment to have an increasingly positive impact over time.
- US secular growth : The market is moving quickly and perhaps needs to pause not to be overbought. However, the reporting season has so far delivered to market expectations with some important upside surprises.
- Commodity-linked equities : This portion of the equity space has not done much, more or less staying flat, which we like in the sense that the equities are cheap, and if economic momentum does pick up, we are likely to see upside that may well diversify risks elsewhere in the portfolio.
Defensive assets
We made only minor changes to our views on defensive assets, maintaining a neutral score for the asset class. Through January bond yields sold off, ending the month marginally higher than where they began the year. We continue to have a relatively large underweight to sovereign bonds, as bond curves are highly inverted which makes owning sovereign bonds relatively expensive from a carry perspective. Overall, we continue to prefer markets which have not inverted, which includes Australia and Japan, as this offers more compelling yields when they are hedged back to local investors. While we do believe that the next move in rates is likely down, we are not as bullish as the market on the number of cuts that will be required. US growth and inflation are both above 3% and the Fed continues to point towards requiring more signs that inflation has indeed slowed down in order to ease rates. Positively, we still have an overweight on EM local currency bonds, with overweights in Mexico, India and Indonesia. These countries all have strong growth prospects and yields above 7%, which are relatively attractive.
We have maintained our positive score on IG credit, and we increased our high yield score to be slightly overweight. For IG credit, adequate levels of yield can be generated in markets such as Australia, UK, Japan and Canada, when using the shorter-dated maturities. In an environment where sovereign bonds are expensive, we prefer to focus on short-dated income to generate yield. Should interest rate curves steepen we would look to extend out our securities, however this is unlikely to occur until central banks begin cutting rates.
ECB vs Fed—who should go first?
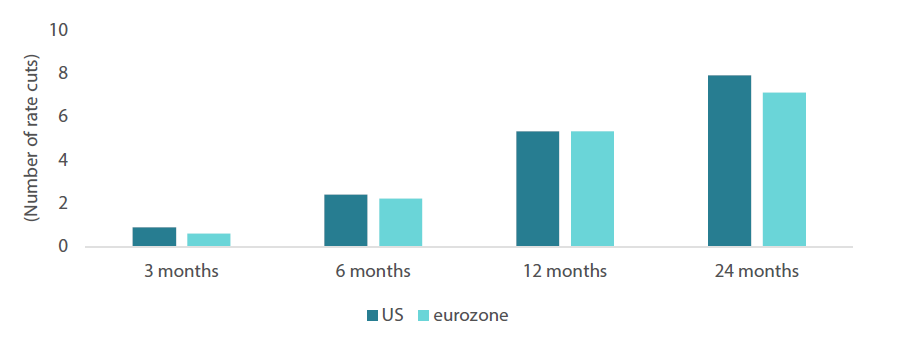
As the markets begin to forecast easing across the world, only minor differences are being priced in the future trajectories of each respective central bank. This can be seen across a number of countries, as over 150 basis points of cuts are priced across the US, UK, Canada and the eurozone over the next two years. While inflation has cooled globally, the similar path of cuts being priced across all countries does not match the economic situations that are occurring. The most obvious of these examples is when comparing the US and the eurozone—Chart 4 below shows that the number of rate cuts being priced over the next 3–24 months are remarkably similar.
Chart 4: Market pricing for cash rate path
Source: Bloomberg, February 2024
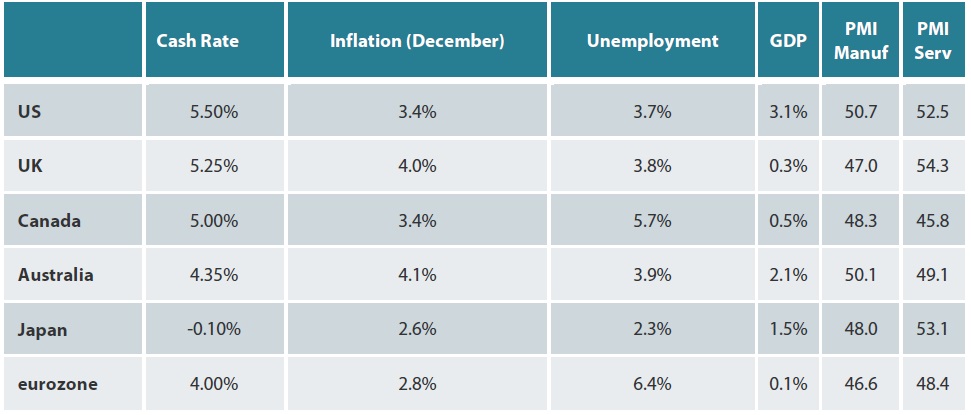
However, despite the similar rate paths the market is expecting, the economic situation is unfolding in a far more precarious way for the eurozone. Currently within the eurozone, inflation has fallen to 2.8%, and prices have risen by only 0.1% over the past six months. In addition, growth in the region has been anaemic at best, with GDP slowing to only +0.1% year-on-year (YoY) at the end of 2023. Growth in the region’s largest economy, Germany, contracted throughout 2023. This economic situation compares poorly with that of the US, where both economic growth and inflation were above 3% for the year. Table 1 shows a broad snapshot of the economic conditions in the developed world. The table shows that when compared to this set of peers, the eurozone has the highest unemployment rate; it also has the lowest inflation aside from Japan.
Table1: Market data for developed economies
Source: Bloomberg, February 2024
When put into this context, it is somewhat perplexing that the market currently expects that the European Central Bank (ECB) will take no more aggressive action than that of an economy that appears to be running above trend. While the Fed has been pushing back against the market’s view that a rate cut could take place as early as March, more recently, the ECB members have begun making dovish comments such as the Bank of Italy’s governor stating that the time for a rate cut is “fast approaching”. Given the state of the economies, we currently foresee the ECB being the central bank that is most likely to move rates, and in our view, this should continue to hold European rates well below that of the US.
Conviction views on defensive assets
- Short-dated IG credit : Credit spreads remain at fair levels but inverse yield curves in many markets make longer-dated credit less attractive. This leaves shorter-dated credit as our preference.
- Gold is still an attractive hedge : Credit spreads remain at fair levels but inverse yield curves in many markets make longer-dated credit less attractive. This leaves shorter-dated credit as our preference.
- Attractive yields in EM : Real yields in this sector are generally very attractive, and we prefer quality EM currencies against the backdrop of a generally weaker dollar.
In-house research to understand the key drivers of return:
1 The Multi Asset team’s cross-asset views are expressed at three different levels: (1) growth versus defensive, (2) cross asset within growth and defensive assets, and (3) relative asset views within each asset class. These levels describe our research and intuition that asset classes behave similarly or disparately in predictable ways, such that cross-asset scoring makes sense and ultimately leads to more deliberate and robust portfolio construction.
2The asset classes or sectors mentioned herein are a reflection of the portfolio manager’s current view of the investment strategies taken on behalf of the portfolio managed. The research framework is divided into 3 levels of analysis. The scores presented reflect the team’s view of each asset relative to others in its asset class. Scores within each asset class will average to neutral, with the exception of Commodity. These comments should not be constituted as an investment research or recommendation advice. Any prediction, projection or forecast on sectors, the economy and/or the market trends is not necessarily indicative of their future state or likely performances.


