The 2015 Paris Agreement was unequivocal: in order to keep global warming to no more than 1.5°C, carbon emissions had to be reduced by 45% by 2030 and reach net zero by 2050. Net zero means cutting greenhouse gas (GHG) emissions as close to zero as possible, with any remaining emissions re-absorbed by the earth’s atmosphere, forests and oceans.
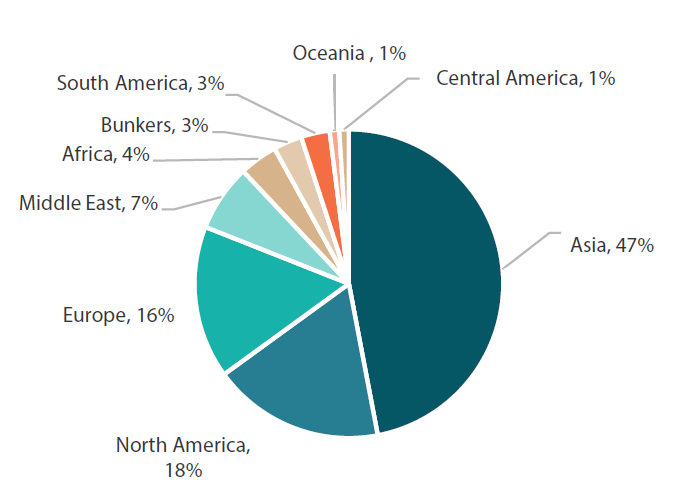
While the net zero target has been top of the global agenda since 2015, the reality is that since then not much appears to have changed. China, the US, India, Russia, and Japan are still the world’s top five carbon emitters (Chart 1). However, there is palpable progress. As of November 2022, some 140 countries had announced or were considering net zero targets, covering close to 90% of global emissions.1
Chart 1: Global emissions by region
 Source: Bloomberg NEF
1 https://climateactiontracker.org/global/cat-net-zero-target-evaluations/
We should also bear in mind that beyond the headline emissions data, the story is more nuanced. For instance, the developing world, particularly Asia Pacific, is under considerable amount of pressure to reduce emissions given China and India are two of the three largest carbon-emitting countries.2 Yet, we need to remember that the region’s rapid development has been reliant on the same energy sources that have supported developed countries in the west for over two centuries.
Going beyond current headline emissions data and looking at historical emissions, developing countries have been calling for equity when it comes to responsibilities in reducing emissions. This is captured in the concept known as common but differentiated responsibilities (CBDR), first mentioned at the inaugural Earth Summit in Rio de Janeiro in 1992. This concept acknowledges that countries have various contributions to environmental degradation, hence, bear common but differentiated responsibilities.3 While climate financing to developing countries has stalled over the past few years, the latest Conference of Parties (COP) 27 meeting saw a significant breakthrough, with an agreement on a new “Loss and Damage” fund to provide climate finance to developing countries faced with impacts of climate change.4
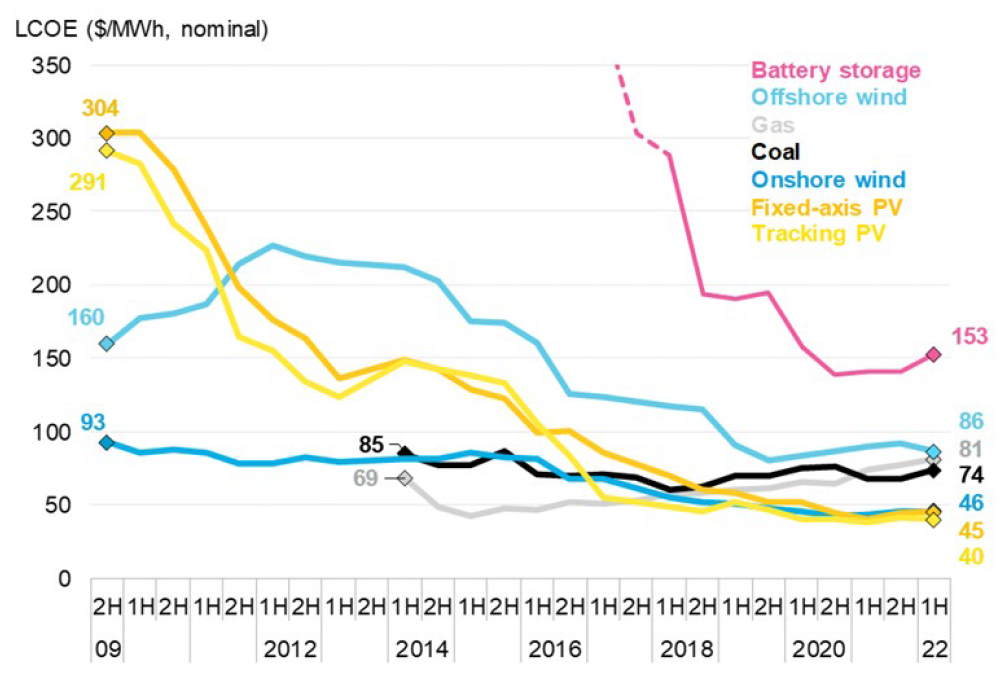
Of course, Asia has a vested interest in tackling climate change given it already faces an increasing number of extreme weather events, including deadly heatwaves, severe hurricanes and droughts. This, together with comparable or even cheaper levelised cost of energy (LCOE) for renewables versus fossil fuels mean it is no surprise that Asian economies are committing to net zero targets and putting in place policies to get there (Chart 2).
Technological advances over the past decade—and economies of scale from large manufacturing set-ups, particularly in China—have resulted in renewable power now being grid-competitive even without subsidies. With strong economic justification, developing economies have started to embrace renewable power in a big way. Asian economies, in particular, are focusing on net zero targets and enacting policies necessary to reach these goals.
Chart 2: Global levelised cost of electricity benchmarks, 2009-2022
Source: Bloomberg NEF
Note: The global benchmark for PV, wind and storage is a country-weighted average using the latest annual capacity additions. The storage LCOE is reflective of a utility-scale Li-ion battery storage system with four-hour duration running at a daily cycle and includes charging costs.
2https://climatetrade.com/which-countries-are-the-worlds-biggest-carbon-polluters/
3https://www.weforum.org/agenda/2022/11/cop27-climate-jargon-explained/
4https://unfccc.int/news/cop27-reaches-breakthrough-agreement-on-new-loss-and-damage-fund-for-vulnerable-countries
Action is following words
Countries in Europe have been on a renewables journey for more than 30 years, making steady but slow progress towards 2030 targets. Asian countries may have started the transition to renewables later, but they have caught up and are even outstripping their European counterparts in terms of renewable energy generation. For example, although India is both the world's second-largest producer and consumer of coal, its solar power generation has increased from 0% to 18% of total energy supply in just six years. Moreover, India plans to add 500 gigawatts (GW) of pure renewables to its electricity grid by 2030.5 For comparison, the total installed renewable capacity in the UK is currently around 40–50 GW, with plans to double that capacity by 2030.6
More recently, India passed an Energy Conservation Bill in 2022 which will mandate its use of clean energy sources. It has also introduced a domestic carbon credit market whereby major power consumers must ensure their energy requirements are met by renewable energy sources. The International Energy Agency (IEA) remarked: “The growth of India’s renewable energy sector has been highly impressive—and India is set to lead the world in areas like solar power and batteries in the coming decades”.7
Meanwhile, China has continued to double down on its renewable energy targets, pledging in 2022 that renewables will account for 33% of national power consumption by 2025 and that non-hydro renewables will contribute 18%.8 China also plays a crucial role in ensuring that the cost of renewables—particularly solar—are more cost-competitive. Without China’s scale, it is questionable whether we would have reached the point whereby solar versus fossil fuel costs have become levelised.
In addition, Asia continues to move forward in terms of research and development on climate-related issues. According to research from McKinsey, Japan, South Korea, China, and India are in the top quartile for numbers of patent filings relating to climate-change mitigation, while South Korea, Japan, China, and Singapore are all in the top quartile of countries for spending on research and development as a percentage of GDP.9
These developments are in stark contrast to recent events in the European Union which have demonstrated the difficulties of maintaining net-zero initiatives. For example, Germany had pledged to phase out all coal-generated electricity by 2038. However, the country was forced to U-turn following the Russia-Ukraine conflict and the subsequent European energy crisis and restarted operations within hard coal-fired power stations that had been earmarked for decommission.
Investment opportunities within Asia
There are multiple pathways towards achieving net zero; from an equity investor perspective, we have identified three where we believe Asia has a significant role to play.
1. Cleaning up and re-engineering of domestic power grids
Power generation and industrial activities are two of the main culprits for carbon emissions. Getting to net zero therefore relies on “clean” power (e.g. solar, wind and hydroelectric) as viable alternatives to coal, gas and oil-fired sources of energy and would significantly reduce scope 1 and scope 2 emissions for the world10
For the transition to a clean power grid to be successful without adversely impacting economic growth, especially in developing countries, clean power has to be as competitively priced when compared to “dirty” energy. This is now starting to prove the case in several Asian countries. In India, for example, solar power tariffs supplied to the grid are significantly lower than coal-fired tariffs. China and India are both implementing the world’s largest (and grid-competitive) wind power installations, while Vietnam, South Korea and Taiwan have also been particularly active in adding to renewable energy capacity recently. This was simply not possible five years ago.
In our view, significant positive fundamental change and investment opportunities have been observed in both the utility and grid capital expenditure sectors.
5https://indbiz.gov.in/india-aiming-500-gw-renewable-capacity-by-2030/
6https://www.nsenergybusiness.com/news/uk-renewable-energy-capacity-2030/
7https://iea.blob.core.windows.net/assets/1de6d91e-e23f-4e02-b1fb-51fdd6283b22/India_Energy_Outlook_2021.pdf
8Renewable Electricity – Analysis - IEA
9McKinsey: “The net-zero transition: What it would cost, what it could bring” (2022).
10The US Environmental Protection Agency defines Scope 1 emissions as direct GHG emissions from sources that are controlled or owned by an organisation (e.g., emissions associated with fuel combustion in boilers, furnaces, vehicles). Scope 2 emissions are indirect GHG emissions associated with the purchase of electricity, steam, heat, or cooling.
2. Global leaders in green energy equipment
Taking the solar panel supply chain as an example, China holds more than an 85% market share for all manufacturing stages of solar panels (polysilicon, modules, cells) —more than double its share of global demand. China's expansion of solar panel markets has helped to significantly boost global solar power uptake and has contributed to bringing down the cost of solar photovoltaic (PV) cells by more than 80% over the last decade. Moreover, while the entire solar energy value chain exists predominantly in China, it is increasingly prevalent in Indonesia and Malaysia as part of a “C+1” strategy.11
And while currently less competitive in the wind and hydrogen global supply chain, Asia is also making big strides in these markets. China and India were in the top five of total global wind energy production in 202112, while South Korea’s 2019 roadmap announced plans to source one-third of its energy from clean hydrogen by 2050, replacing oil as its largest single energy source.13 More recently it has announced the goal of producing 30,000 hydrogen commercial vehicles and building 70 liquid hydrogen-refuelling stations by 2030.14 Watch this space.
3. The electrification of transport
Transportation, including road, air, rail, sea and other forms accounts for approximately 21% of annual global CO₂ emissions.15 The transition towards clean transport infrastructure vehicles—replacing internal combustion engine vehicles with electric vehicles (EVs) and those powered by hydrogen fuel cells—is expected to make a significant contribution towards achieving net zero.
Asia leads globally in battery cell and related component manufacturing. Battery storage and grid-level electricity storage relies on metals such as lithium, cobalt or nickel. Again, the supply chain for all of that is heavily dependent on either Asia or the emerging markets (Chart 3). EV sales have caused demand to grow exponentially, and it is looking increasingly unlikely that Asia’s leading manufacturers will be dislodged as economies of scale become more entrenched. The lithium-ion battery market is expected to grow from US dollar (USD) 57 billion in 2020 to USD 200 billion by 2027 , and the key components are currently supplied from China, South Korea and Japan.
Chart 3: Geographical distribution of the global EV battery supply chain
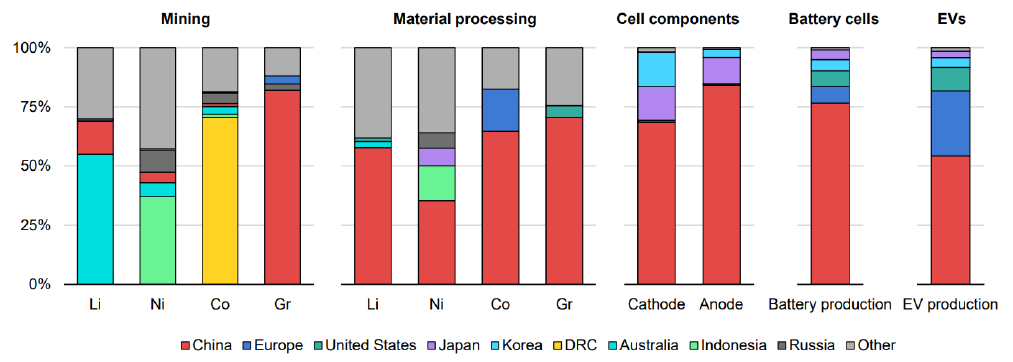
Notes: Li = lithium; Ni = nickel; Co = cobalt; Gr = graphite; DRC = Democratic Republic of Congo. Geographical breakdown refers to the country where the production occurs. Mining is based on production data. Material processing is based on refining production capacity data. Cell component production is based on cathode and anode material production capacity data. Battery cell production is based on battery cell production capacity data. EV production is based on EV production data. Although Indonesia produces around 40% of total nickel, little of this is currently used in the EV battery supply chain. The largest Class 1 battery grade nickel producers are Russia, Canada and Australia.
Source: IEA analysis based on: EV Volumes; US Geological Survey (2022); Benchmark Mineral Intelligence; Bloomberg NEF.
11C+1 is the business strategy relating to global supply chains that avoids investing only in China and diversifies parts of the supply chain into other countries.
12https://worldpopulationreview.com/country-rankings/wind-power-by-country
13https://www.weforum.org/agenda/2022/02/clean-hydrogen-energy-low-carbon-superpowers/
14https://www.h2-view.com/story/south-korea-announces-new-hydrogen-policies-and-goals/
15https://ourworldindata.org/co2-emissions-from-transport
Summary
While Asia is one of the regions facing the loudest calls to “clean up” carbon emissions, those vital components that will help the entire world to achieve net zero targets are also being produced, utilised and exported by Asia. This puts Asia under unique pressure to not only have to decarbonise their mostly coal-fired power grid, but at the same time, grapple with energy security and provide the world with the means to decarbonise. In other words, the west cannot decarbonise in isolation, and we have to go beyond headline emission numbers; any discussion of net zero has to consider the role played by Asia, not as part of the problem, but in driving the solution.
As investors, it makes sense to focus on where the scope for fundamental change is greatest. Asian countries have an imperative to transition from dirty to clean energy, but they also have the will and the resources—human, technological and natural—with which to do so. As a result, we believe that Asian companies are well-positioned to participate and drive the change whilst making higher sustainable returns for their shareholders.
Net zero is a global challenge that requires a united response. All countries and regions need to decarbonise. But there are substantial rewards on the table, in our view, for those who are capable of driving that push for global decarbonisation. So, the question is: who is building the kit for the world’s net zero ambitions? We believe that the answer, both now and well into the future, is Asia.


